Dynamic Analysis
Objective
The aim of this section is to perform DAST for DVNA with OWASP ZAP, W3AF and generate a report to provide a solution to the 1st point of the problem statement under Task 2.
DAST
DAST or Dynamic Application Security Testing is a black-box testing technique in which the DAST tool interacts with the application being tested in its running state to imitate an attacker. Unlike static analysis, in DAST one does not have access to the source code of the application and the tool is completely reliant on the interactivity the application provides. In dynamic analysis, tools are used to automate attacks on the application ranging from SQL Injection, Input Validation, Cross-Site Scripting, and so forth.
OWASP ZAP
ZAP or Zed Attack Proxy is an open-source tool used to perform dynamic application security testing designed specifically for web applications. ZAP has a desktop interface, APIs for it to be used in an automated fashion and also a CLI. It imitates an actual user where it interacts with the application to perform various attacks. ZAP comes with a plethora of options to use, for which further details can be found here. ZAP also comes as a Docker image which is more convenient to use especially if one is using the CLI interface.
Docker is a tool designed to provide ease in shipping applications across platforms. It packages the application, along with all its dependencies and other required libraries into an image. Then containers (running instances of the image) can be used to run the application on any machine. It is similar to a virtual machine but it differs greatly from them based on the fact that it does not require a full-fledged operating system to run the application. Instead, it runs the application on the system's kernel itself by just bringing along the required libraries with it which could be missing on machines other than the one the application was built on. This allows Docker-based applications to be portable i.e. they can be run on any machine that can run Docker containers. It allows for various versions of the same tool/library running on a host as different containers do not care about what is happening inside another container. Further information on docker can be found in the official documentation.
Configuring OWASP ZAP with Docker
To use ZAP with docker, I needed to pull the image from docker hub and start off. I used this documentation from Mozilla as it had a lot of errors demonstrated along with their rectification steps for starting out with ZAP. This was missing from all the other sources I found.
Note: While running ZAP scans below, I explicitly ran DVNA, without Jenkins, for it to be tested.
- To start off with ZAP, I pulled the docker image by running:
docker pull owasp/zap2docker-stable
- Then I tried to run the tool with its CLI interface. The CLI threw an error which was because of an encoding inconsistency between Python2 and Python3. To rectify this issue, I had to explicitly specify the encoding to be used with the help of some environment variables. These environment variables can be seen in the command below along with the
-eflag for Docker to inject these environment variables in the container:
docker run -e LC_ALL=C.UTF-8 -e LANG=C.UTF-8 -i owasp/zap2docker-stable zap-cli --help
- Next I ran a
quick-scanto have a look at how ZAP outputs information. Since ZAP is running inside a Docker container, I could not uselocalhostor127.0.0.1as then the container would take it to be its own host. So, to overcome this issue I used the IP assigned todocker0, the network interface created for Docker. This IP can be found with this one-liner:$(ip -f inet -o addr show docker0 | awk '{print $4}' | cut -d '/' -f 1).Also, as ZAP also has an API that can be used to interact with it programmatically, I had to use--start-options '-config api.disablekey=true'as otherwise, ZAP tried (and failed) to connect to the proxy as the API key was not specified. Also, the-loption specifies the severity level at which ZAP should log a vulnerability to console (or to a report). The--self-containedflag tells ZAP to turn off the daemon once the scan is complete and the--spideroption tells ZAP to crawl the target to find other links present on the target site. The complete command is as mentioned below:
docker run -e LC_ALL=C.UTF-8 -e LANG=C.UTF-8 -i owasp/zap2docker-stable zap-cli quick-scan --start-options '-config api.disablekey=true' --self-contained --spider -l Low http://172.17.0.1:9090
- Now, I tried the
active-scanoption. For this I first needed to start the daemon for zap to be accessed by the CLI, runopen-urlto add the target URL to the configuration in ZAP-CLI (without this,active-scanoption will not start a scan on the target) and then run the scan against DVNA. This step was not required previously as while running aquick-scan, the daemon is automatically started to run the scan and stopped after the scan is finished. To do run the daemon with Docker, I ran the following command (with the-u zapsegment to execute things with thezapuser instead of Docker's defaultrootuser and I also appended the--rmflag to delete the container, automatically, when I stop it):
docker run --rm -e LC_ALL=C.UTF-8 -e LANG=C.UTF-8 --name zap -u zap -p 8090:8080 -d owasp/zap2docker-stable zap.sh -daemon -port 8080 -host 0.0.0.0 -config api.disablekey=true
docker exec <CONTAINER NAME/ID> zap-cli open-url <TARGET URL>
docker exec <CONTAINER NAME/ID> zap-cli active-scan <TARGET URL>
Note: When I ran the scan initially, it dropped an error from Python saying that the 'Connection was Refused' while sending requests to the target through the ZAP proxy. It turned out to be an issue with the command written in the blog that I was following. It exposed the wrong port and hence rectifying the port options in the command to -p 8090:8080 and -port 8080 solved the issue and the scan worked. Another thing is that I chose 8090 for the host port as I already had Jenkins running on 8080.
-
Now to be able to scan DVNA from the CLI with ZAP-CLI, I required a context which basically was a configuration written in XML to define how to perform a scan. This context also had a set of credentials in it that were recorded with a ZEST script, which is a JSON-based form used to record interactions between a website and a user specially created for security tools focused on web applications. This context file along with the ZEST script would allow
zap-clito authenticate with DVNA to be able to scan the portion of the application that lies behind the login screen. I used the browser-based GUI to generate the context and the Zest script and exported them to the machine. But importing them created various complications aszap-cliwas unable to identify the embedded Zest script in the context provided to it. -
Due to the above complications, I decided to use Zap's baseline scan instead. To start off ZAP baseline scan with the docker image, I ran the following command, where the
-tflag specified the target and-lflag defined the alert/severity level, by following this documentation:
docker run -i owasp/zap2docker-stable zap-baseline.py -t "http://172.17.0.1:9090" -l INFO
- Now, to save the report on the Jenkins machine, I needed to mount a volume with Docker. I used the
-vflag (as mentioned in the docker documentation) to mount the present working directory of the host to the/zap/wrkdirectory of the container and also added the-rflag to save scan output to a HTML report on the Jenkins machine:
docker run -v $(pwd):/zap/wrk/ -i owasp/zap2docker-stable zap-baseline.py -t "http://172.17.0.1:9090" -r baseline-report.html -l PASS
Integrating ZAP with Jenkins
- After understanding how to use the baseline-scan and its various options, I started integrating the scan as part of DAST in the Jenkins pipeline. But before I could scan DVNA with ZAP Baseline, I needed to build the dependencies and start an instance of DVNA. To do the same, I also had to fetch code from the repository on GitHub (explicitly, because I didn't use a Jenkinsfile for this task).
Note: I chose to build a new pipeline just for DAST, as combining SAST and DAST in a single pipeline would have taken too much time during each execution which felt unnecessary at the time of development.
- To start off, I added a stage to fetch the code from the GitHub repository as follows:
stage ('Fetching Code') {
    steps {
        git url: 'https://github.com/ayushpriya10/dvna.git'
    }
}
- Next, I built the dependencies for DVNA, as I did while performing SAST, and started an instance of DVNA, as mentioned in the stage mentioned below:
stage ('Building DVNA') {
    steps {
        sh '''
            npm install
            source /{PATH TO SCRIPT}/env.sh
            pm2 start server.js
        '''
    }
}
Note: I kept all the required environment variables in the env.sh file which can be seen in the above stage, and used it to export those variables for DVNA to be able to connect with the database. While trying to export the variables, the shell that comes along with Jenkins kept throwing an error 'source not found' i.e. saying it didn't recognize the command source. This turned out to be because that by default the sh shell in Jenkins points to /bin/dash which doesn't have the command source. To rectify this, I changed the Jenkins shell to point to /bin/bash instead with this command - sudo ln -sf /bin/bash /bin/sh, which I found in this blog. This method, however, will change the symlink for sh to bash for every user on the system (which can be created by other applications, such as Jenkins itself). This might break the functioning of the other applications and hence, it is more advisable to specify the changed shell for the specific user on the system that needs it. In the context of Jenkins, the recommended way would be to use usermod -s /bin/bash jenkins to change the default shell only for Jenkins.
- Now, that DVNA was up and running, ran the baseline scan on it with docker and Zap. But I had to wrap the command in a shell script to evade the non-zero status code that ZAP gives on finding issues. So, I wrote the script,
baseline-scan.sh, mentioned below and made it executable withchmod +x:
cd /{JENKINS HOME DIRECTORY}/workspace/node-dast-pipeline

docker run -v $(pwd):/zap/wrk/ -i owasp/zap2docker-stable zap-baseline.py -t "http://172.17.0.1:9090" -r baseline-report.html -l PASS

echo $? > /dev/null
Note: One thing to take note of is that Jenkins would require to use sudo when running docker commands as it's not part of the docker user group on the system. This is the preferred way, that the required docker setup is on another VM and Jenkins SSHs into the other VM with access to run docker commands as a sudo user. But for the purpose of this task, I did not set up another VM, instead, I added the jenkins user to the docker user group with - sudo usermod -aG docker jenkins, for it to be able to perform an operation without using sudo. This, however, is not recommended.
- I added a stage in the Jenkins Pipeline, to execute the shell script and generate the DAST report. The stage's content is mentioned below:
stage ('Run ZAP for DAST') {
    steps {
        sh '/{PATH TO SCRIPT}/baseline-scan.sh'
    }
}
Note: Running the pipeline threw an access error, saying the report could not be written in the directory. This was because the zap user in the docker container did not have write permission for Jenkins' workspace. So, for the sake of the task, I modified the permissions of the node-dast-pipeline/ directory with chmod 777 node-dast-pipeline/. This is also not recommended. If the permissions need to be changed, they should be specific and exact in terms of the access they grant which should not be more than that is required.
- Lastly, I added a stage to stop the instance of DVNA that was running as it was no longer needed and moved the report generated from the workspace directory to the reports directory that I've been using for the tasks:
stage ('Take DVNA offline') {
    steps {
        sh 'pm2 stop server.js'
        sh 'mv baseline-report.html /{JENKINS HOME DIRECTORY}/reports/zap-report.html'
    }
}
The complete pipeline script is as follows:
pipeline {

    agent any

    stages {
        stage ('Fetching Code') {
            steps {
                git url: 'https://github.com/ayushpriya10/dvna.git'
            }
        }

        stage ('Building DVNA') {
            steps {
                sh '''
                    npm install
                    source /{PATH TO SCRIPT}/env.sh
                    pm2 start server.js
                '''
            }
        }

        stage ('Run ZAP for DAST') {
            steps {
                sh '/{PATH TO SCRIPT}/baseline-scan.sh'
            }
        }

        stage ('Take DVNA offline') {
            steps {
                sh 'pm2 stop server.js'
                sh 'mv baseline-report.html /{JENKINS HOME DIRECTORY}/reports/zap-report.html'
            }
        }
    }
}
On a different note, I also tried running a docker agent in the Jenkins pipeline to execute zap-baseline scan but it kept throwing an access error (different than the one mentioned above). This issue is not rectified yet. The stage that I wrote (but was not working) is as follows:
stage ('Run ZAP for DAST') {
    agent {
        docker {
            image 'owasp/zap2docker-stable'
            args '-v /{JENKINS HOME DIRECTORY}/workspace/node-dast-pipeline/:/zap/wrk/'
        }
    }
    steps {
        sh 'zap-baseline.py -t http://172.17.0.1:9090 -r zap_baseline_report.html -l PASS'
    }
}
W3AF
W3AF or the Web Application Attack and Audit Framework is another DAST tool like OWASP ZAP. Like ZAP, W3AF has both, a web-based GUI as well as a command-line interface. It is able to identify 200+ distinct vulnerabilities including SQL Injections, Cross-Site Scripting and OS Command Injection.
Configuring W3AF
- Referring to the official documentation for W3AF, I first cloned the project's repository and moved into the project directory:
git clone https://github.com/andresriancho/w3af.git && cd w3af/
- Since, I was ultimately going to run the tool with the command-line interface as part of the pipeline, I skipped using the GUI that was available and started the CLI as follows:
./w3af_console
- I ran the console version of the tool, even though I knew it would not work (initially) since it had missing dependencies because W3AF automatically generates a bash script under
/tmpfor the user to install the unmet dependencies. The script just contains the command the user would have ran on the terminal manually, it just tries to make the tool easier to use to improve user's experience while using the tool. After executing W3AF's console script to generate the dependency-installation script, I ran it to install the missing dependencies for W3AF:
/tmp/w3af_dependency_install.sh
-
Once all the dependencies were installed, I executed the console script again to start the CLI for W3AF. It uses a prompt-based system, prefixed with
w3af>>>as the prompt, and there are various options to configure the tool before launching the scan with it. I followed along the documentation to understand the various options and configurations that W3AF supports. -
W3AF also supports automation by allowing the user to write a configuration script, which is nothing but the exact same commands that one would have ran in the prompt in that same sequence written in a file, and pass it to W3AF with the
-sflag. So, I picked up a template script from the project's repository which had all the scan options enabled. I did, however, made some amendments to the script. I removed the segment for bruteforcing injectable fields, I added a block to add authentication for DVNA and lastly made some changes by replacing values in the script to fit DVNA's context. The finished script,w3af_scan_script.w3af, is mentioned below:
# Traversing into the Plugins Menu
plugins

# Configuring output options
output console,text_file
output config text_file
set output_file output-w3af.txt
set verbose True
back
output config console
set verbose False
back

# Configuring audit Options
audit all
audit

# Configuring grep options
grep all
grep

# Configuring crawl options
crawl all, !bing_spider, !google_spider, !spider_man
crawl

# Configuring auth options
auth detailed
auth config detailed
set username admin
set password admin
set username_field username
set password_field password
set data_format %u=%U&%p=%P
set auth_url <AUTH URL>
set method POST
set check_url <VERIFICATION URL>
set check_string 'Logout'
back

# Traversing from plugin menu to main menu
back

# Configuring target options
target
set target <TARGET URL>
back

# Launching the scan
start

# Exiting from W3AF after the scan
exit
- W3AF behind-the-scenes takes the commands written in the script mentioned above and passes them to the prompt on its own, allowing users to not have to pass arguments through the CLI prompt. Lastly, to launch the tool and start the scan with W3AF, I ran the following command, passing the script mentioned above:
./w3af_console -s w3af_scan_script.w3af
Configuring Jenkins for Distributed Builds
After having so many tools configured on the Jenkins VM, it was getting tedious to manage all of them on the same server. So, to do away with this issue, I used to Master-Agent architecture that Jenkins supports to use a new VM to run DAST on DVNA with W3AF installed on a jenkins agent running under the new VM.
Configuring Agent VM for Jenkins
- The first step to creating an agent VM for Jenkins is to create a working directory where all the files associated with the Jenkins project will be kept along with some additional files/executables that Jenkins will use to use the Agent. I chose to create a
/var/jenkinsdirectory as follows:
mkdir /var/jenkins
- Once, the directory was created I had to change the ownership of the directory to the non-root user (
ayush) to avoid having to usesudowith commands that run on the Agent. To change the ownership of the directory, I used the following command:
sudo chown ayush: /var/jenkins/
- Then for the non-root user to be able to write files in the directory via Jenkins Agent, I gave the user write permissions. This allowed Jenkins Master node to write an
agent.jarfile on the Agent VM which will be used to provision jobs to the agent. I used the following command to modify the write access to the directory:
sudo chmod u+w /var/jenkins
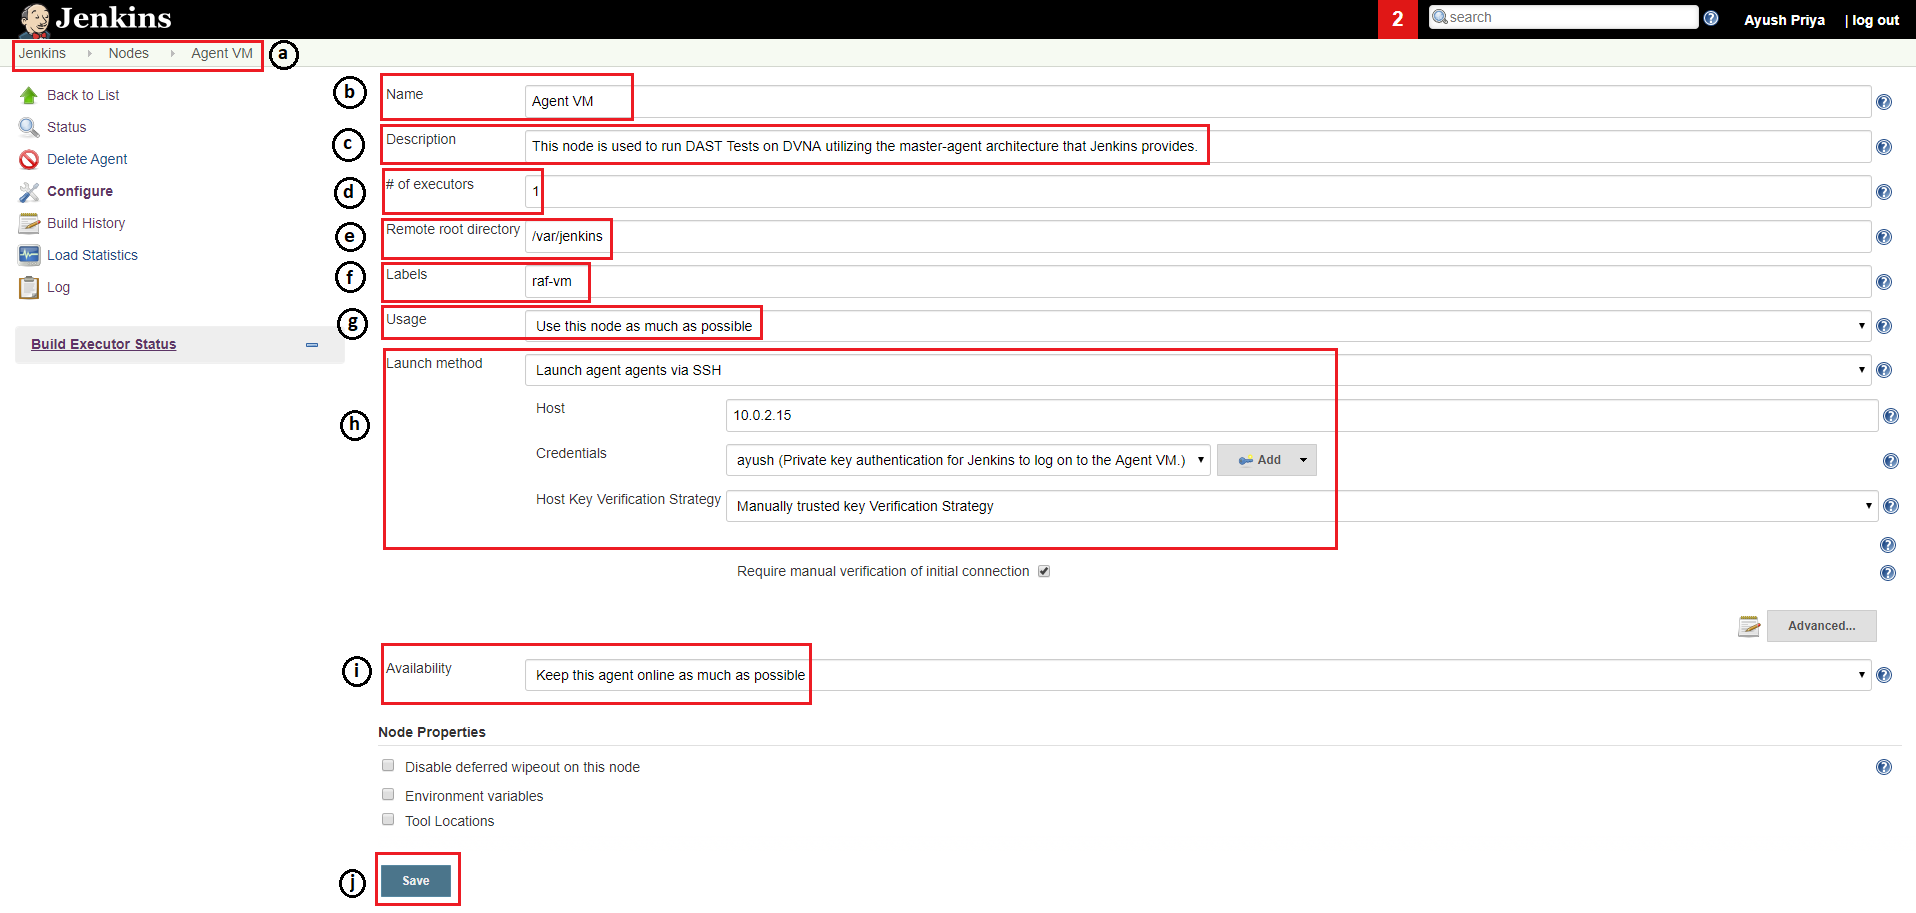
- To create an agent with Jenkins, I followed the following steps:
- I navigated to
Dashboard > Manage Jenkins > Manage Nodes > New Node. - I gave a name to the node,
Agent VM, in this case, selected thePermanent Agentoption (as the VM being used was managed outside of Jenkins) and clicked onOkay. - Then I gave a brief description of what the Agent will be used for.
- I left the number of executors to the default setting of
1. - Under
Remote root directory, I provided/var/jenkinswhich I configured earlier while setting up the Agent VM. - I added the label
raf-vmso I could use this label to specify stage(s) to use this agent instead of the master node. - I chose the
Use this node as much as possibleoption but since it is being used for only one task, it does not make any difference. - Under
Launch method, I chose theLaunch agent agents with SSHoption. I added the IP of the Agent VM and provided the credentials required to log on to the VM. I leftHost Key Verification Strategyto the default ofManually trusted key Verification Strategy. - Under
Availability, I left the default option ofKeep this agent online as much as possible. - Lastly, I clicked on
Save.
- I navigated to
- Now, I had to launch the agent so Jenkins can provision jobs to it. The following are the steps I performed to do so:
- I navigated to
Dashboard > Manage Jenkins > Manage Nodes. - I clicked on
Agent VM(the name of the node I gave). - I clicked on
Launch agentbutton to bring the node online and connect it to the Jenkins master node.
- I navigated to
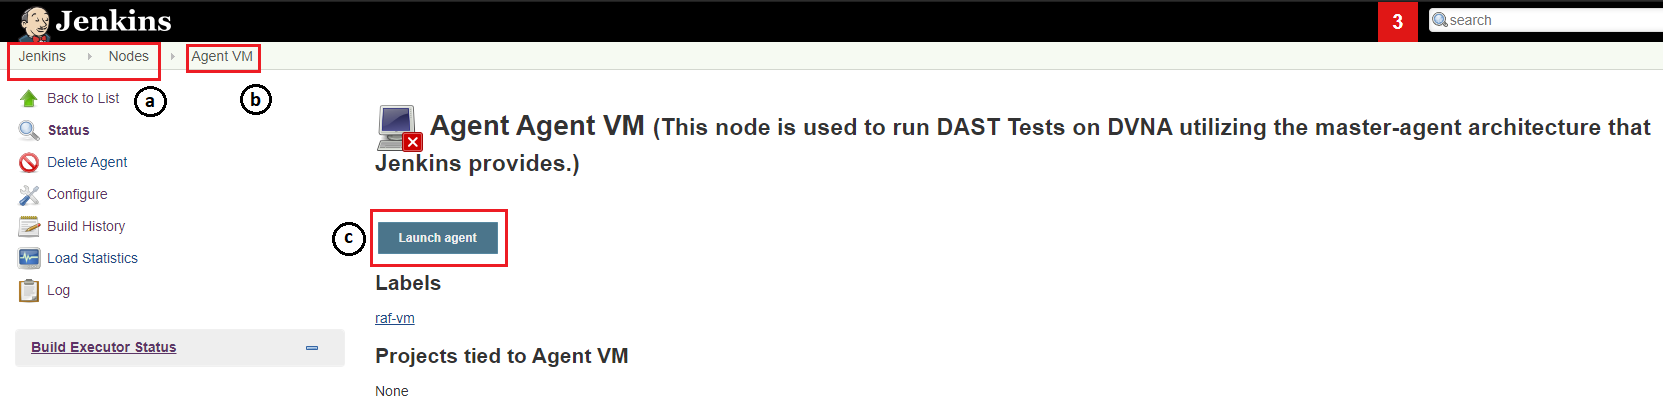
Note: When I launched the agent for the first time, it did not work as I did not have Java installed on the VM. So, I installed the required JRE with the command - sudo apt install default-jre. Relaunching the agent after installing Java worked and the agent was online and connected to the master node of Jenkins successfully.
- The only thing remaining was to install W3AF on the Agent VM. I followed the first three steps as mentioned under the 'Configuring W3AF' above to do the same.
Integrating W3AF with Jenkins
Now that the Agent VM was fully configured and integrated with Jenkins, I had to amend the pipeline script, that I was using previously, to accommodate the new tool being used as well as utilize the newly provisioned agent node.
-
I started off by amending the script, that I wrote initially, to use the IP of the Jenkins VM as that was were DVNA would be running. So, I replaced all
localhostentries with10.0.2.19:9090, which is where the app was running. I placed the script in the Agent VM itself to not have to copy it every time I had to perform DAST and also because of the fact that, once written, it will not be changed frequently. -
Next, I wrote a stage to perform the scan with W3AF, save the report on the Agent VM and then copy it over to the Jenkins VM. I also specified that Jenkins provisions this stage to the Agent VM by using the label I assigned to it while creating the node. Since the SSH keys I used were for a user other than the
jenkinsuser, I could not have directly copied the report over to the reports directory inside Jenkins' home directory as this would have resulted in aPermission Deniederror so, I first copied the file the non-jenkins user's home directory and will move it to the required location in the upcoming stage. The contents of the stage are below:
stage ('Run W3AF for DAST') {
    agent {
        label 'raf-vm'
    }

    steps {
        sh '/{PATH TO SCRIPT}/w3af/w3af_console -s /{PATH TO SCRIPT}/scripts/w3af_scan_script.w3af'
        sh 'scp -r /{PATH TO OUTPUT}/w3af/output-w3af.txt chaos@10.0.2.19:/{HOME DIRECTORY}/'
    }
}
- Lastly, I copied the report from the home directory of the non-jenkins user to the reports directory under Jenkins' home directory where all the other reports were kept from all the other scans. The stage I wrote to do the same is as follows:
stage ('Copy Report to Jenkins Home') {
    steps {
        sh 'cp /{HOME DIRECTORY}/output-w3af.txt /{JENKINS HOME DIRECTORY}/reports/w3af-report'
    }
}
The complete pipeline script, after adding stages for W3AF and removing redundant steps, is as follows:
pipeline {

    agent any

    stages {
        stage ('Fetching Code') {
            steps {
                git url: 'https://github.com/ayushpriya10/dvna.git'
            }
        }

        stage ('Building DVNA') {
            steps {
                sh '''
                    npm install
                    source /{PATH TO SCRIPT}/env.sh
                    pm2 start server.js
                '''
            }
        }

        stage ('Run ZAP for DAST') {
            steps {
                sh '/{PATH TO SCRIPT}/baseline-scan.sh'
            }
        }

        stage ('Run W3AF for DAST') {
            agent {
                label 'raf-vm'
            }

            steps {
                sh '/{PATH TO SCRIPT}/w3af/w3af_console -s /{PATH TO SCRIPT}/scripts/w3af_scan_script.w3af'
                sh 'scp -r /{PATH TO OUTPUT}/w3af/output-w3af.txt chaos@10.0.2.19:/{HOME DIRECTORY}/'            }
        }

        stage ('Take DVNA offline') {
            steps {
                sh 'pm2 stop server.js'
                sh 'mv baseline-report.html /{JENKINS HOME DIRECTORY}/reports/zap-report.html'
                sh 'cp /{HOME DIRECTORY}/output-w3af.txt /{JENKINS HOME DIRECTORY}/reports/w3af-report'
            }
        }
    }
}